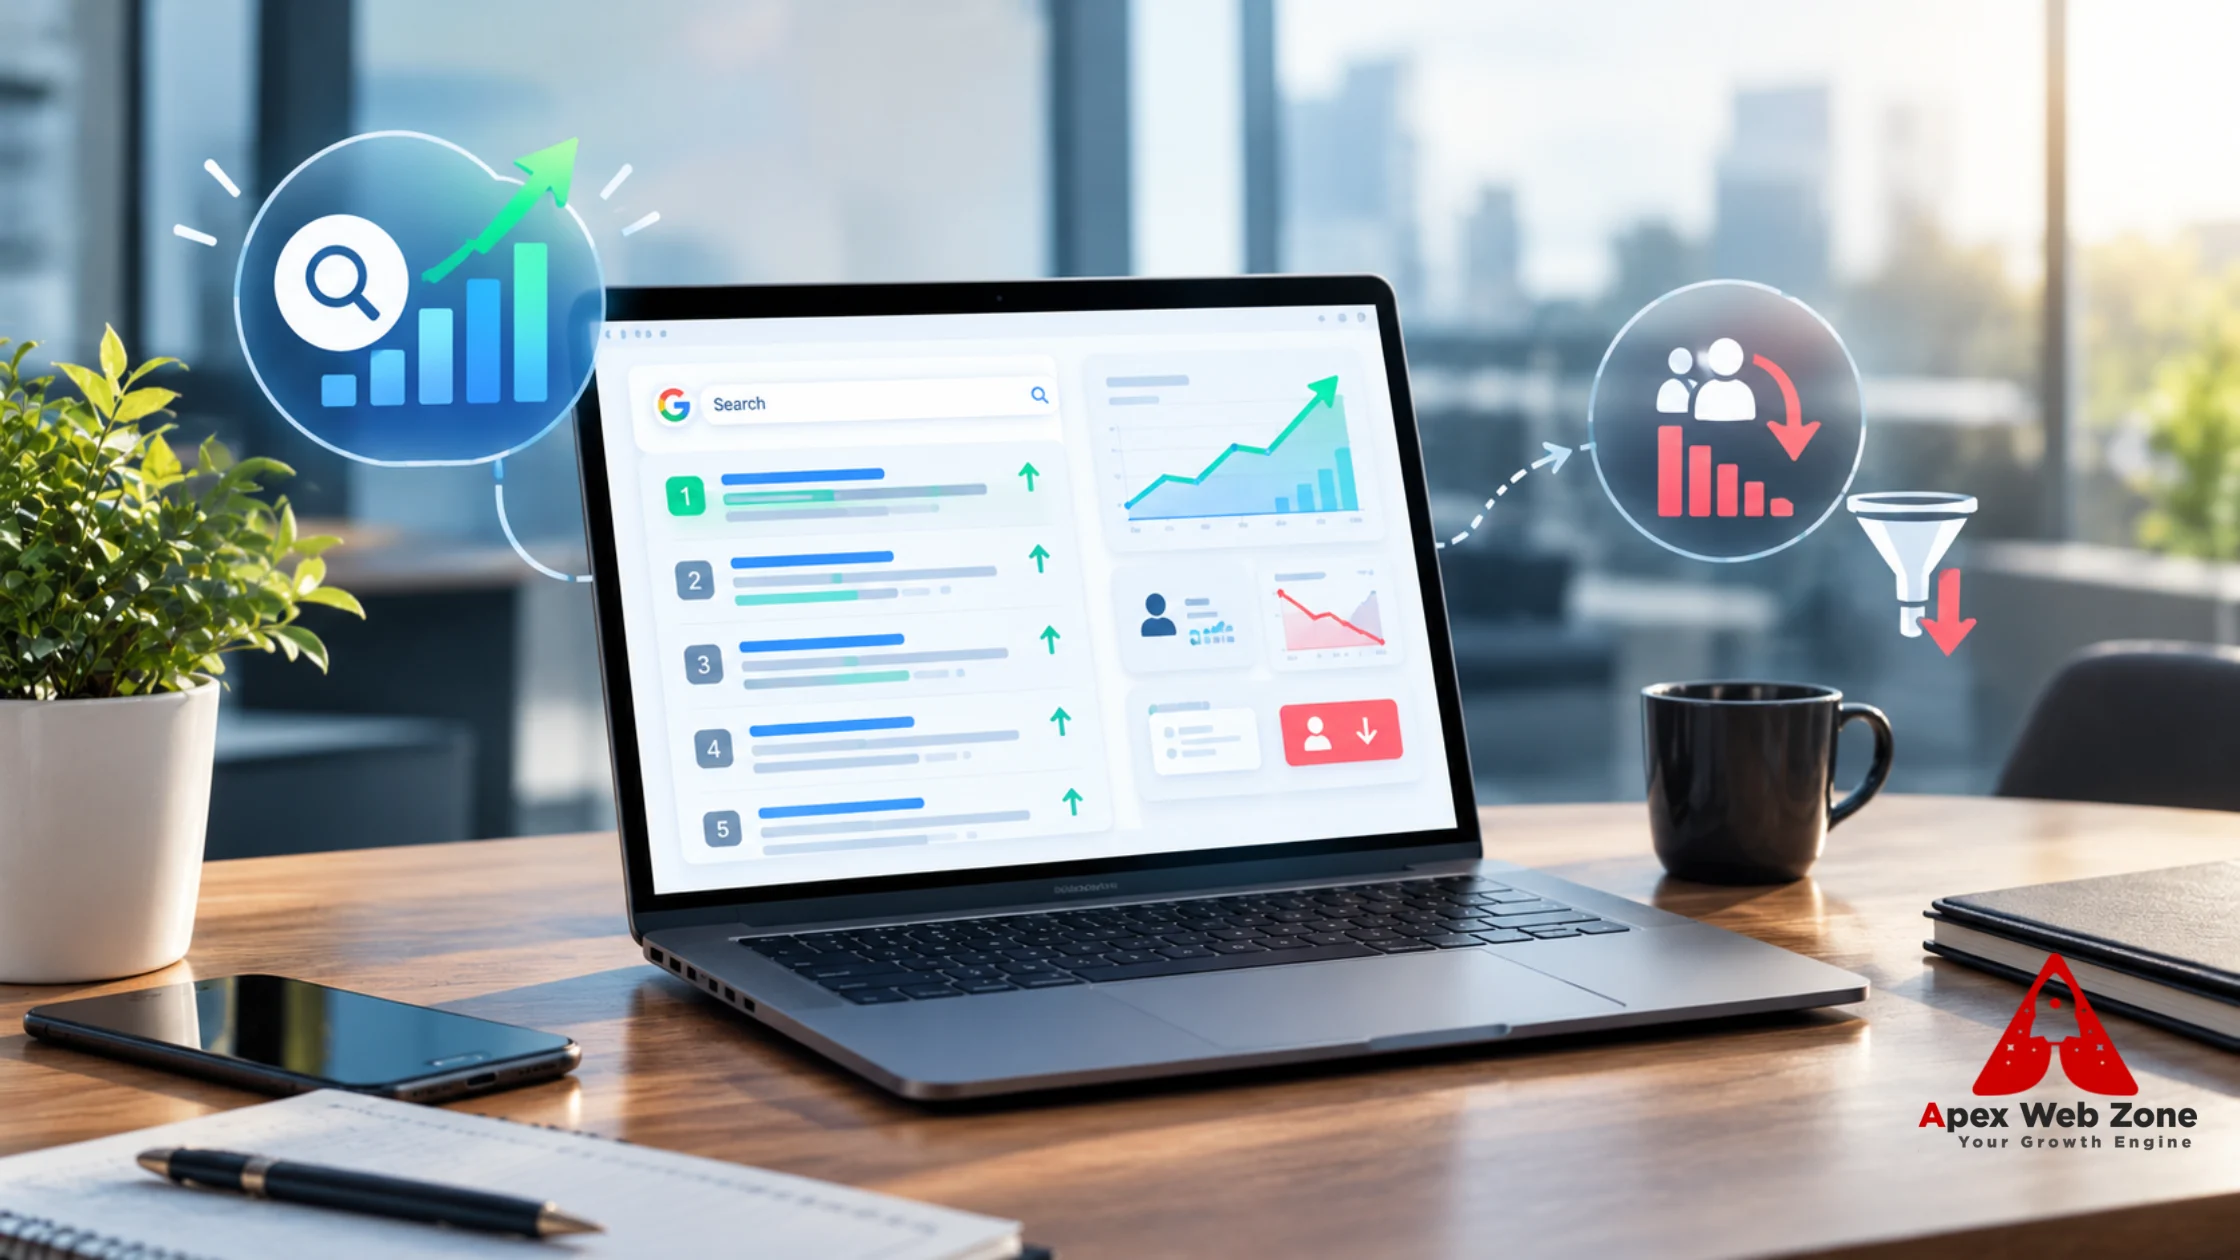
Your dashboard shows three lines that no longer agree. Rankings hold, with your key pages still in the top three. Clicks from search are sliding. And demo requests, the number your CEO actually asks about, are down.
It is tempting to treat this as one problem and reach for one fix. It is at least three. A ranking is a position. A click is a decision a searcher makes after seeing everything on the results page. A demo request is a decision a visitor makes after reading your page. Each can fail on its own, and each needs a different repair.
This guide is written for B2B marketing leaders. It shows how click behavior changed through 2025 and 2026, how Search Console counts position in a way that can now mislead you, how to tell lost clicks from lost leads, and which on-page changes are worth testing first. Where the evidence is mixed or thin, we say so.
Short answer: Rankings, clicks and leads are three different measurements, and in 2026 they can move in opposite directions. Google’s AI Overviews, featured snippets and richer result pages reduce clicks even when your position holds, and some B2B research now starts in AI chatbots. Diagnose which link in the chain broke before you change anything.
Why do you lose clicks on keywords where you still rank in the top three?
You lose clicks in the top three because position shows where your link sits, not how much attention it gets. An AI Overview or snippet can sit above you, and Search Console counts an impression even if no one scrolls to it. Pew found clicks on traditional results in 8% of visits with an AI summary, versus 15% without.
Three things sit behind the gap.
Position is not attention. Google defines Search Console position as the topmost position your link occupied for a query, averaged across queries. It also says an AI Overview occupies a single position and that every link inside it shares that position. A featured snippet typically occupies position 1. So “position 1.0” in your report can mean a cited link inside an AI Overview or a snippet, not the first blue link a buyer sees.
Impressions count whether or not anyone saw you. Google counts an impression when your link is in the current page of results, even if it was never scrolled into view. A result in position three that sits below an AI Overview, a snippet and a video block can collect impressions that nobody viewed.
Fewer people click anything. Pew Research analyzed the browsing of 900 U.S. adults in March 2025, covering 68,879 Google searches. Users clicked a traditional result in 8% of visits when an AI summary appeared and 15% when it did not. They clicked a link inside the summary in just 1% of visits. They ended their browsing session on 26% of pages with a summary against 16% without. AI summaries appeared on 18% of all searches in that data, and on 60% of searches that began with a question word.
Pew’s study is U.S.-only, Google-only and now more than a year old, but it remains the cleanest behavioral measurement available because it tracked what real people did next.
You will also see AI Overview coverage quoted anywhere from 13% to 64% of queries on agency blogs. Those figures measure different things: different query sets, industries and dates, often without a traceable source. Pew’s 18% covers all searches from its panel. Seer Interactive’s 2026 data splits by intent: AI Overviews appeared on about 36% of informational queries, 8% of commercial queries and 5% of transactional queries across 53 brands. We use only figures we could trace to a primary source.
How did click-through rates change in 2025 and 2026?
Click-through rates fall on page one for two separate reasons: more of the page is occupied by answers, and your own listing may no longer earn the click. Google says that when impressions hold but clicks drop, your title and snippet may be weak or competitors may have a more appealing result. Check both causes before blaming AI.
Here is the 2025 to 2026 record from the studies we could verify:
When | Source | What it found |
|---|---|---|
March 2025 | Pew Research | Clicks on traditional results in 8% of visits with an AI summary, 15% without |
April 2025 | Ahrefs | Position-one click-through about 34.5% lower on AI Overview keywords |
December 2025 | Ahrefs | Position-one click-through 58% lower, across 300,000 keywords |
December 2025 to February 2026 | Seer Interactive | Organic click-through on AI Overview results was 1.31% in December and 2.36% in February, against 3.82% when no AI Overview appeared |
These studies use different methods and metrics, so do not read the rows as one trend line. They do agree on direction. Ahrefs also found the damage is largest at the top of the page: roughly 58% lower at position one, 46% at position three, 33% at position five and 19% at position ten. Seer’s early-2026 data shows a partial recovery from the December low, and Seer warns against forecasting from two months of data. The honest reading is a large drop through 2025, a partial rebound in early 2026, and no return to the old baseline on informational queries.
Google’s own debugging guide adds the part that is easy to miss. AI Overviews are one cause among several. Seasonality, changing search interests, algorithm updates and technical problems can all move traffic, and a weak title or snippet loses clicks on its own. For the mechanism behind how AI answers choose sources, see our guide on how AI decides which brands to cite.
Why are demo requests down even though rankings have not dropped?
Demo requests can fall while rankings hold because the chain from ranking to lead has five links: impression, click, visit, form view and submission. A break at any link looks the same on a rank report. Find which link failed using Search Console for clicks and your analytics or CRM for visits and leads.
Link in the chain | Where to check it | What a break looks like |
|---|---|---|
1. Impression | Search Console impressions | Impressions fall: demand moved or queries are answered elsewhere |
2. Click | Search Console click-through rate | Impressions flat, clicks down |
3. Qualified visit | Analytics by landing page | Clicks flat, but visits from the right intent fall |
4. Form view | Page analytics | Visits flat, fewer people reach the form |
5. Submission | CRM and form events | Form views flat, submissions down: errors, friction or broken tracking |
Not every lost click is a lost lead. Informational clicks, such as “what is” and “how does” queries, are mostly top-of-funnel, and they are the queries AI answers most often. If those fall while demo requests from product and comparison pages hold, you lost low-intent traffic, not pipeline. The reverse is serious: if demo requests fall on high-intent pages, the cause is not AI Overviews.
Some of the demand may never reach Google. G2 surveyed 1,076 B2B software buyers in March 2026. It found 51% now start research with an AI chatbot more often than with Google, up from 29% in its 2025 survey. About 61% use AI search alongside Google. And 85% think more highly of a vendor an AI chatbot includes in its answer, while 69% chose a different vendor than they had planned because of a chatbot’s recommendation. Two cautions apply. G2 sells review-site services, so it has a commercial interest in the finding. And it surveyed software buyers only, so treat it as directional for other B2B categories.
The practical response is cheap. Add a “How did you hear about us?” field to your demo form, with an AI chatbot option. Self-reported attribution catches what click tracking cannot.
Use this table to match the pattern in your data to a likely cause:
Pattern in your data | Likely cause | First check | Typical fix |
|---|---|---|---|
Impressions flat, clicks down, position stable | A SERP feature or AI Overview takes the click, or your snippet is weak | Run the query yourself and compare what sits above you and how competitors title their pages | Rewrite title and opening lines; add something that earns the click |
Impressions down, position stable | Demand moved, or queries are answered elsewhere | 16-month year-over-year view and Google Trends | Reset expectations; track brand demand; add research-stage content |
Clicks flat, demo requests down | A post-click problem | Conversion by landing page, form errors, recent page changes, tracking | Fix message match, the form or tracking |
Clicks down on how-to queries, demos flat | Low-intent traffic lost | Compare by intent segment against pipeline | Report pipeline; shift effort to decision-stage pages |
Clicks and demos down on product and comparison queries | A real competitive or ranking loss | Position by query; competitor offers and titles | Strengthen pages and offers; follow Google’s guidance on position drops |
Branded searches down | A demand problem beyond SEO | Brand queries in Search Console; Google Trends | Involve demand generation and brand teams |
How do you separate lost clicks from lost leads?
To separate lost clicks from lost leads, compare 16 months of Search Console data year over year, split queries into brand and non-brand and by intent, then match the affected landing pages to demo requests in your analytics or CRM. Where clicks fell but leads held, you lost low-intent traffic. Where both fell together, investigate further.
This method follows Google’s own guide to debugging traffic drops, with the lead join added:
- Set the date range to the last 16 months. This shows whether the drop repeats every year. Google recommends it to rule out seasonality.
- Compare periods. Compare the last three months with the previous period and with the same period last year. Check the query, page, country, device and search appearance tabs to see where the change sits.
- Read the chart shape. If impressions and clicks both fell, work through Google’s list of common causes. If impressions held and clicks fell, look at titles, snippets and competing results.
- Segment the queries. Use the custom regex filter to split brand from non-brand, using your company name and common misspellings. Split question-style queries with a pattern such as
^(who|what|when|where|why|how|which|can|does|is|are)\b. Then separate informational, comparison and vendor queries by hand for your top 50 terms. - Find the pages that lost the most. Sort the Pages table by clicks difference, as Google suggests, and note whether the loss is site-wide, a group of pages or one important page.
- Join the pages to leads. Export those landing pages and match them to demo requests and pipeline from your analytics or CRM. This is the step most teams skip.
- Run the live queries. Search your top terms on desktop and mobile. Note what sits above you. Google says your own result position can differ from the Search Console average because of location and search history, so treat this as a sample, not proof.
- Write it down. Record each query group in a worksheet like the one below.
Query group | Impressions change | Clicks change | CTR change | Average position change | Demo requests change | Diagnosis |
|---|---|---|---|---|---|---|
|
|
|
|
|
|
|
Also check Google’s Search Console data anomalies page, because a drop can come from a change in data processing or a logging error rather than from real behavior.
Which on-page changes recover clicks and leads?
The on-page changes that recover clicks are the ones a searcher sees before visiting: the title tag, the opening lines Google may use as a snippet, and a result that clearly matches the query. The changes that recover leads are on the page itself: message match, proof, a short form and one clear next step.
The list below covers every on-page element involved, split into what earns the click and what earns the lead. Our on-page SEO service works through the same list.
Title tag: the first thing buyers weigh
Google names the title and snippet as places where clicks are lost when impressions hold steady. Lead with the searcher’s job, add one specific differentiator, and match the intent of the query: a definition, a comparison or a vendor search. Avoid stacking keywords. Check how Google actually displays your title in results, since it may differ from your tag. These examples use a fictional company and are illustrations, not client results:
Page type | Before | After (illustrative) | What changed |
|---|---|---|---|
Product page | Marketing Analytics Software | Acme | Marketing Analytics for B2B Teams: Features, Pricing, Demo | Acme | Names the buyer and the next step |
Comparison page | Acme vs Rival | Acme vs Rival: Feature and Pricing Comparison (2026) | Says what the reader will see and when it was checked |
Guide | What Is Revenue Attribution? | Revenue Attribution Explained: 4 Models and When to Use Each | Promises detail a short AI summary cannot fully deliver |
Snippet: the meta description and your opening lines
Google says it builds snippets mainly from page content and uses the meta description only when it describes the page more accurately. It also says there is no length limit, but snippets are cut to fit the device width. So do two things. Write a unique meta description for every important page, summarizing what the page delivers. And write the first two or three sentences of the page so they work on their own as a snippet.
Headings and the answer-first opening
Put a direct answer of 40 to 60 words under each question-style heading. It makes the page easier for readers to scan and for systems to quote, although Google says no special formatting is required for its AI features. Then give the reader a reason to click after the answer: a worked example, a template, a calculator or original data. A page that only restates what a summary already says gives no reason to visit.
URL and internal links
Use short, readable URLs that describe the page, and avoid changing URLs on pages that already perform, because moves can cause ranking fluctuations. Link from high-impression informational pages to the decision-stage pages that convert, using descriptive anchor text such as “marketing attribution pricing” rather than “click here.” This sends the visitors who do click toward your demo page.
Structured data
Google says structured data is not required for its generative AI features and that no special markup exists for them. Use it where it accurately describes visible content and qualifies a page for a supported rich result. Article, breadcrumb and organization markup are sensible for a B2B site. Do not expect schema to repair a click-through problem on its own.
Trust signals on the page
Show a named author with a role, a visible last-updated date, and sources for any statistic. Add customer proof only if it is real and current. These details help a buyer decide between two similar results, and they matter more now that fewer buyers see your page at all.
The demo page itself
This is where a lost lead is won back. Check these items one by one:
- Message match. The headline should confirm the promise made in the title and snippet that brought the visitor.
- One primary action. Remove competing calls to action near the form.
- A short form. Ask only for what sales uses to qualify and follow up.
- Expectations. Say what happens next and how long the call takes.
- Real proof. Use customer names, results or reviews that you can verify.
- Speed and mobile. Test the page on a phone and fix anything that blocks the form.
- Tracking. Confirm the form fires a conversion event, the thank-you step works, and source data reaches your CRM. A broken tag can look exactly like a demand drop.
- Self-reported source. Add the “How did you hear about us?” field described above.
How to test changes safely
Google advises avoiding radical changes to pages that already perform well, and suggests waiting a few weeks before reassessing. So test, do not rewrite everything. Pick 10 to 20 pages where position is stable but click-through is falling. Change the titles and descriptions on half of them and leave the other half as a control. Change one element at a time, log the date, and compare click-through between the two groups in Search Console after several weeks. Account for seasonality by comparing against the same period last year. Our content development team can rebuild pages that need more than a rewrite.
What should B2B marketing leaders report instead of rankings?
Report impressions, click-through rate by query segment, qualified leads by landing page, branded search trend and pipeline, with rankings as context. Rankings alone no longer predict revenue. Pair these with a monthly check of how AI tools describe your company, because some buyers form a shortlist before they ever reach your site.
Metric | Where it comes from | Why it matters now |
|---|---|---|
Impressions and CTR by query segment | Search Console | Shows where the click was lost, split by brand, intent and question type |
Qualified demo requests by landing page | Analytics and CRM | Separates lost traffic from lost pipeline |
Branded search trend | Search Console and Google Trends | Shows whether demand for your name is growing or shrinking |
Self-reported source | Demo form field | Captures influence from AI chatbots and other untracked paths |
AI answer check | Monthly prompt log | Shows how ChatGPT, Gemini and Perplexity describe you |
Average position | Search Console | Useful context, not a success measure |
On the last row, Google itself says impressions and clicks are the measure of success for your site, and that you should not focus too much on absolute position.
What should you do in the first 30 days?
Spend week one on a baseline, week two on segmentation and the lead join, week three on the ten highest-impact page fixes, and week four on measuring and reporting. Do not rewrite everything at once. Google advises against radical changes to pages that already perform well, so test changes on a subset first.
This schedule is a suggested order of operations, not a promised timeline.
Week | Focus | Output |
|---|---|---|
1 | Baseline | 16-month Search Console view, year-over-year comparison, current demo request and pipeline numbers |
2 | Segment and join | Query groups and landing pages matched to leads; the diagnosis worksheet filled in |
3 | Fix | Ten pages with new titles, descriptions and opening lines; demo page checks and tracking fixes |
4 | Measure and report | Control-group comparison started; a one-page report with the diagnosis and the next tests |
Where does the Free Organic CTR & Search Opportunity Audit fit?
The audit is the fastest way to run the method above on your own site. It is built around the questions in this guide: where your click-through rate lags your position, what sits above you in the results, which titles and snippets to rewrite first, and whether the path from landing page to demo request is leaking leads.
A typical audit covers:
- A click-through gap analysis by query group and page group.
- A map of what appears above your listing for your top queries.
- A prioritized list of title, snippet and opening-line rewrites.
- A check of the path from landing page to demo request: message match, form and tracking.
- A short list of quick wins, where position is strong but click-through lags.
We will need read-only access to Search Console and your analytics. Request your free audit or contact our team and we will tell you what is worth fixing and what is not. You can also look at our wider SEO services, or at our earlier post on why rankings can look healthy while traffic falls, which covers the general case.
How we researched this
We read Google’s documentation on debugging traffic drops, Search Console metrics and snippets, along with studies from Pew Research, Ahrefs, Seer Interactive and G2. We also reviewed how five current articles on the topic treat it. We did not run our own click-through study, and none of the figures above come from Apex Web Zone client data. Ahrefs, Seer Interactive and G2 are commercial vendors, so we treat their studies as directional. Results vary by industry, query mix and device, so verify any figure against your own Search Console before acting on it.
Frequently asked questions
Because a top-three position no longer guarantees attention. AI Overviews, featured snippets and other result blocks can sit above or beside your listing, and Search Console counts an impression whether or not anyone scrolls to it. Pew found clicks on traditional results fell from 15% to 8% of visits when an AI summary appeared.
Two things change at once: results pages answer more questions directly, and competitors’ titles and snippets compete harder for the remaining clicks. Ahrefs measured a 58% lower click-through rate for position one when an AI Overview appeared in December 2025. Review your own titles and snippets alongside the SERP layout before concluding it is all AI.
No. AI Overviews are one cause, but seasonality, changing interests, weaker titles and snippets, and competitors’ richer results also lower click-through. Google’s debugging guide recommends comparing periods, filtering by query, page, device and search appearance, and checking Google Trends before deciding what changed.
Yes, in the standard Performance report. Google says a click on an external link in an AI Overview or AI Mode counts as a click, and all links in an AI Overview share its single position. Google also launched a Generative AI performance report in June 2026 for a subset of sites, and its announcement lists impressions rather than clicks.
Change them carefully. Google advises avoiding radical changes if a page is already performing well, and suggests waiting a few weeks before reassessing in Search Console. Test on a small group of pages with falling click-through, change one element at a time, and keep a record of what you changed and when.
Yes, but Google does not always show them. It builds snippets mainly from page content and uses the meta description when it describes the page more accurately. Write a unique description for each important page, and make the first lines of body copy work as a snippet too.
Match landing pages from Search Console to demo requests and pipeline in your analytics or CRM. If clicks fell on informational pages but qualified demo requests held, you mainly lost low-intent visits. If demos fell on high-intent pages or branded queries, treat it as a real problem and investigate.
Many software buyers use both. G2’s March 2026 survey of 1,076 software buyers found 51% start research with an AI chatbot more often than with Google, and 61% use AI search alongside Google. G2 sells review services, and the sample covers software buying only, so treat it as directional for other B2B categories.
Google says some changes take effect in a few days while others take several months, and suggests waiting a few weeks before reassessing in Search Console. Fixes on the page itself, such as the form or message match, can be measured sooner in your analytics, so track those separately.
A zero-click search ends without a click to any website, because the searcher gets the answer on the results page. Pew found around two-thirds of Google searches in its study ended without a click on a result link, whether or not an AI summary appeared. The share varies by query type, so measure your own segments.

